Jira Time plan is a good tool to track work items from feature till subtask. You can create each and every work items and guide the team to execute the plan in very nice way.
But that needs a very technically sound team with full understanding of the work they perform.
A chaotic team with random way of executing task, and not fully understand the way it should work makes Jira a Tool to blame! Why NOT ??
I have worked both in a full grown well established organisation, in open source as well as start up scenario and I have it all …
SO WHY NOT WRITE A SCRIPT …
As always, can it be scripted for you need and track what you want… of course..I will give it a try…
Again, this is for people who want own custom controlled graphical view for tracking in a smaller scale…
We Will Lead The Way Through Python
If you want to download the code, check my github link : Jira Epic tracker
Setup JIRA Configuration
from jira import JIRA
from graphviz import Digraph
# Jira server and credentials
#TODO : Add Jira details
jira_server = ‘https://<YOUR JIRA PROJECT>.atlassian.net’
jira_user = ‘<JIRA USER NAME>’
jira_api_token = ‘<JIRA API TOKEN>’ # use API token for Atlassian Cloud
jira = JIRA(server=jira_server, basic_auth=(jira_user, jira_api_token))
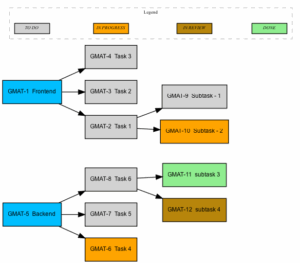
Color Scheme for status
# Status → color mapping
status_colors = {
“To Do”: “lightgray”,
“In Progress”: “orange”,
“IN REVIEW”: “darkgoldenrod”,
“Done”: “lightgreen”,
}
Use your Custom Filter to get issue details, like different projects, conditional issues etc
# Example JQL: fetch all issues in a project, USE your own filter for your work
#TODO : Create your own query filter for Epics, you can increase the max limit
issues = jira.search_issues(‘project=<YOUR PROJECT SHORT NAME> and issuetype in (Epic)’, maxResults=100)
for issue in issues:
print(f”{issue.key}: {issue.fields.summary}, {issue.fields.issuetype}, [{issue.fields.status.name}]”)
dot = Digraph(comment=”Jira Hierarchy”, format=”png”)
dot.attr(rankdir=”LR”) # Top to Bottom
dot.attr(‘node’, shape=’rectangle’, style=’filled’, fontname=”Arial”, fontsize=”9″, fillcolor=’deepskyblue’, color=”black”, penwidth=”1″)
Create parent -> Child Linking
for issue in issues:
print(f”\nEpic: {issue.key} – {issue.fields.summary}”)
epic_item=f”{issue.key}{issue.fields.summary}”
dot.node(epic_item)
# Fetch children of the epic
jql=f’Parent = {issue.key}’
children=jira.search_issues(jql, maxResults=100)
if children:
for child in children:
print(f” Task: {child.key} – {child.fields.summary} – {child.fields.status.name}”)
child_issue=f”{child.key}{child.fields.summary}”
# Get status of Task
fillcolor=status_colors.get(child.fields.status.name, “white”) # default white if unknown
dot.node(child_issue, fillcolor=fillcolor)
dot.edge(epic_item, child_issue)
# Check if issue has sub-tasks
if hasattr(child.fields, ‘subtasks’) and child.fields.subtasks:
for subtask in child.fields.subtasks:
print(f” SubTask: {subtask.key} – {subtask.fields.summary} – {subtask.fields.status.name}”)
# Get status of Subtask
fillcolor=status_colors.get(subtask.fields.status.name, “white”) # default white if unknown
subtask_issue=f”{subtask.key}{subtask.fields.summary}”
#parent_child.append((child_issue, subtask_issue)) # (parent, child)
dot.node(subtask_issue, fillcolor=fillcolor)
dot.edge(child_issue, subtask_issue)
else:
print(” No child issues found”)

Plot the Graphical View
FINALLY…
You can view all the items in different status … Voila !